Reduction in time spent on manual reporting and analysis.
- Home
- Case studies
- Mau Brands
Case study · Mau Brands
How we built Mau Brands' Amazon analytics platform
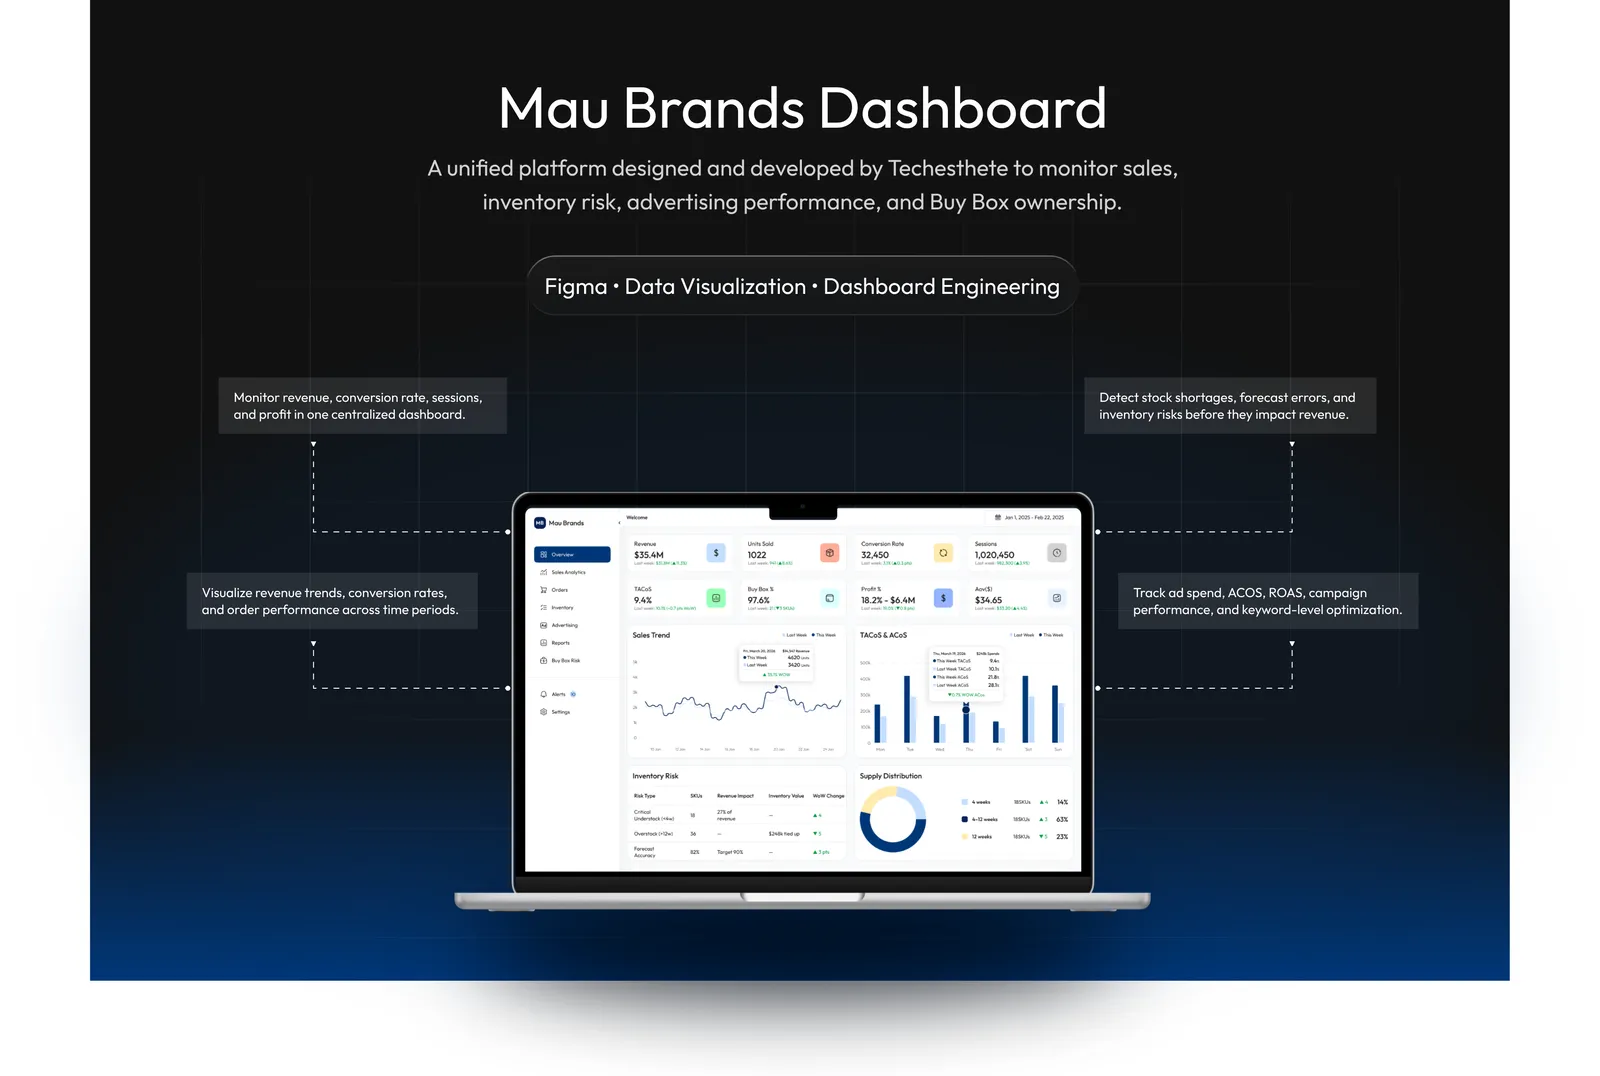
Mau Brands is an ecommerce analytics and operations platform designed to give Amazon sellers and agencies complete visibility into their business performance. The platform consolidates data from multiple sources including sales, inventory, advertising, and pricing into a single, unified dashboard. We built the SP-API and Ads API pipelines, warehouse and dashboards behind it.
- Amazon marketplace · Ecommerce analytics
- Ongoing partnership
- Amazon Seller Central
- Amazon SP-API
- Amazon Ads
Results
What changed, in numbers.
Improvement in campaign performance through data-driven decisions.
Inside the build
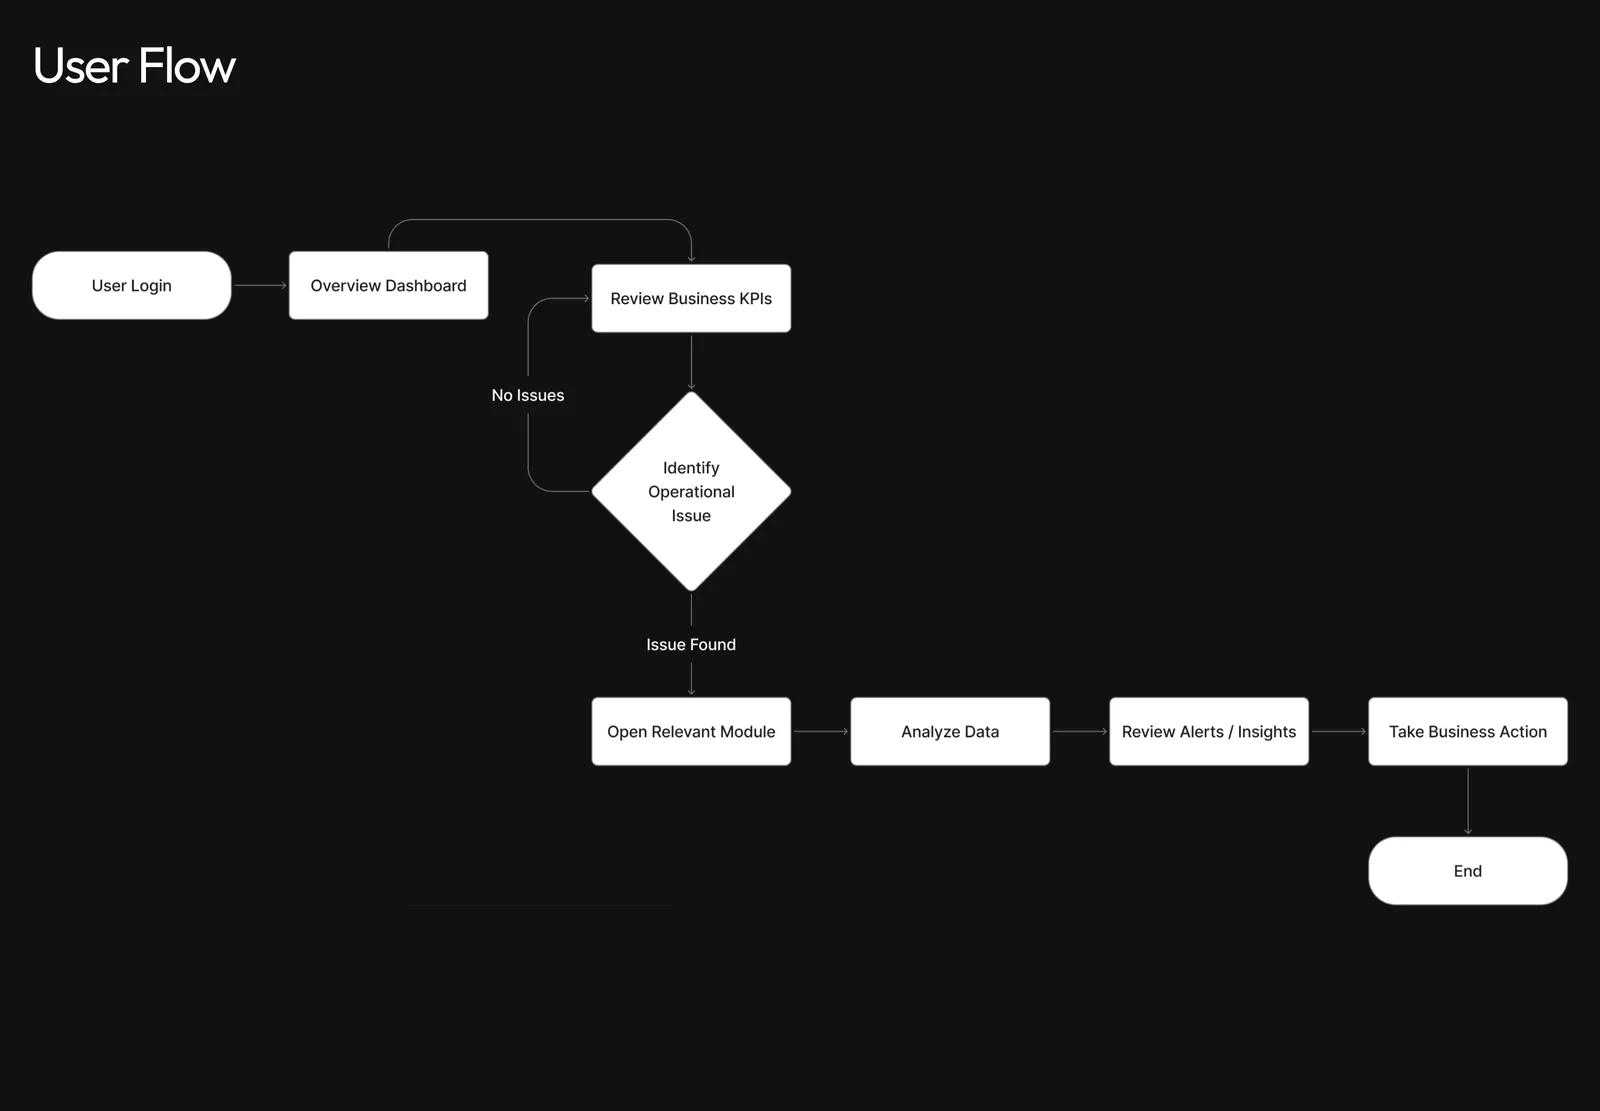
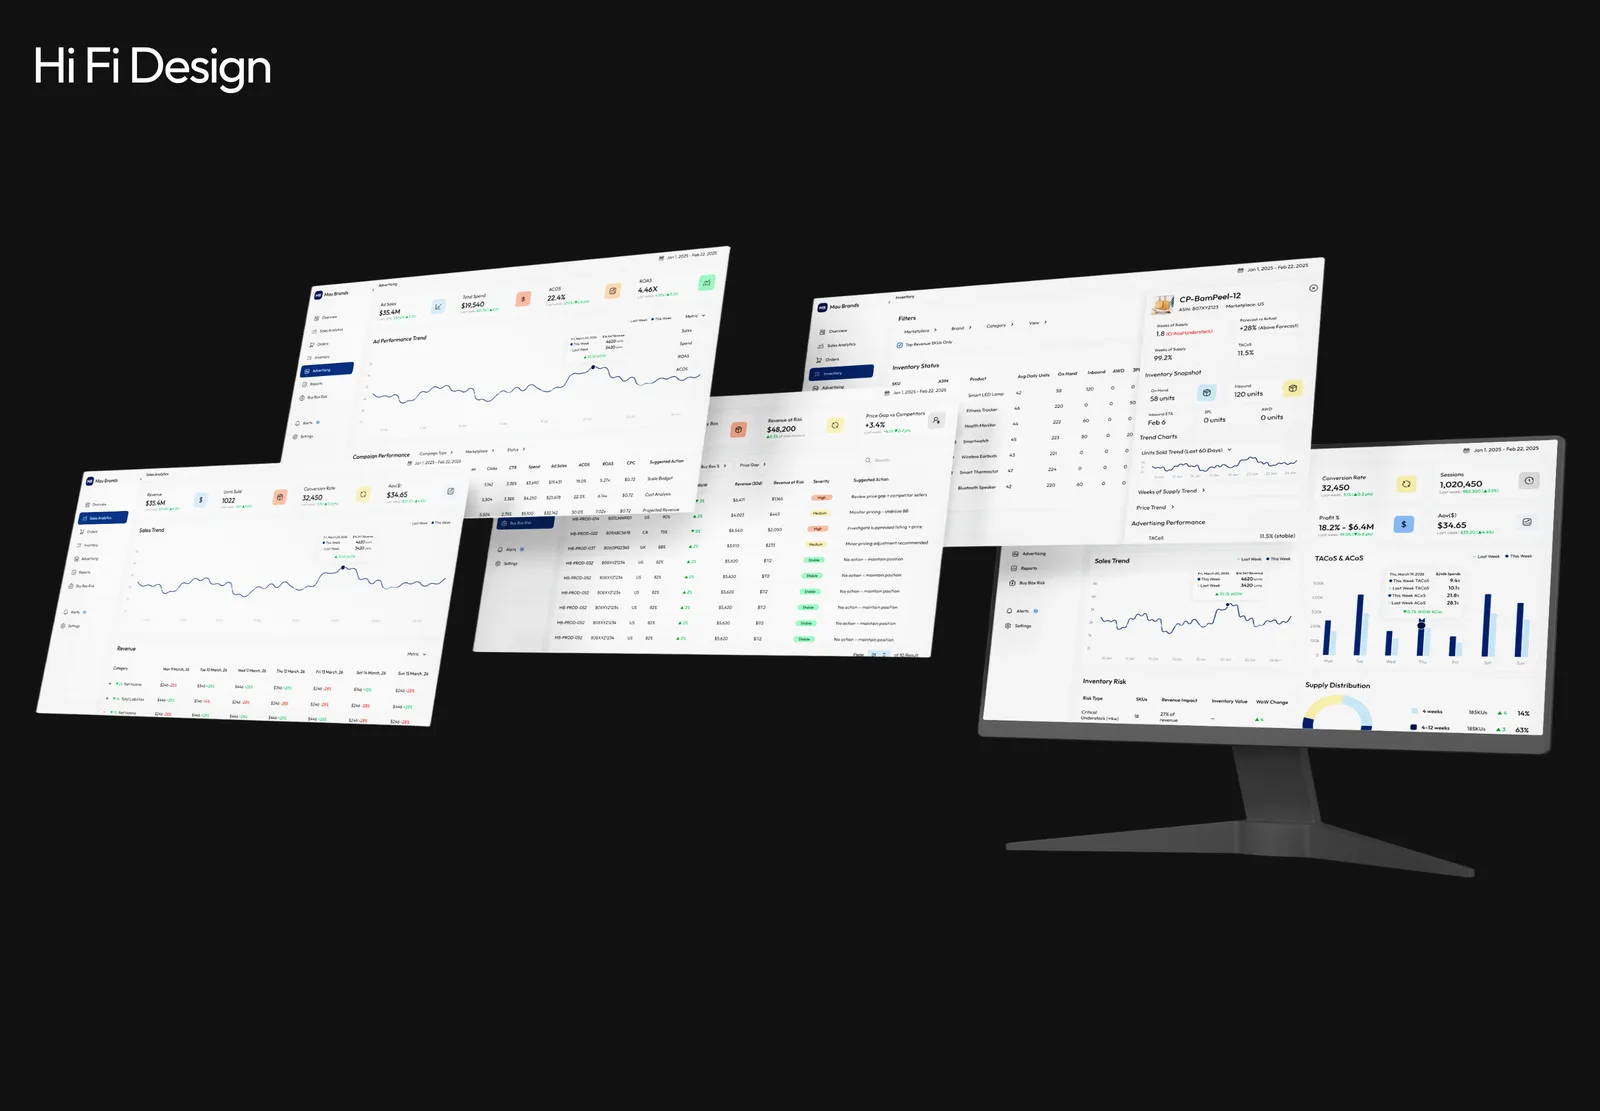
Screens, flows and designs from the build.
6 images from the Mau Brands project. Select any image to see it larger.
About the project
About Mau Brands.
Mau Brands is a data-driven ecommerce analytics platform that helps Amazon brands optimize performance, manage inventory, and make faster business decisions.
TechEsthete designed and developed the system to solve key operational challenges such as fragmented data, delayed decision-making, and lack of actionable insights.
- Client
- Mau Brands
- Industry
- Amazon marketplace · Ecommerce analytics
- Engagement
- Ongoing partnership
- Services
- Data engineering, Analytics platform, Inventory intelligence, Advertising insights
The challenge
- Ecommerce brands and agencies often struggle with data scattered across multiple tools (Seller Central, Ads Manager, spreadsheets), lack of real-time insights for decision-making, difficulty tracking inventory risks and forecasting demand, inefficient campaign optimization due to poor visibility, and Buy Box losses without clear root cause analysis.
- These challenges lead to delayed actions, revenue loss, and operational inefficiencies.
What we built
TechEsthete designed and built a centralized analytics platform focused on clarity, speed, and actionability.
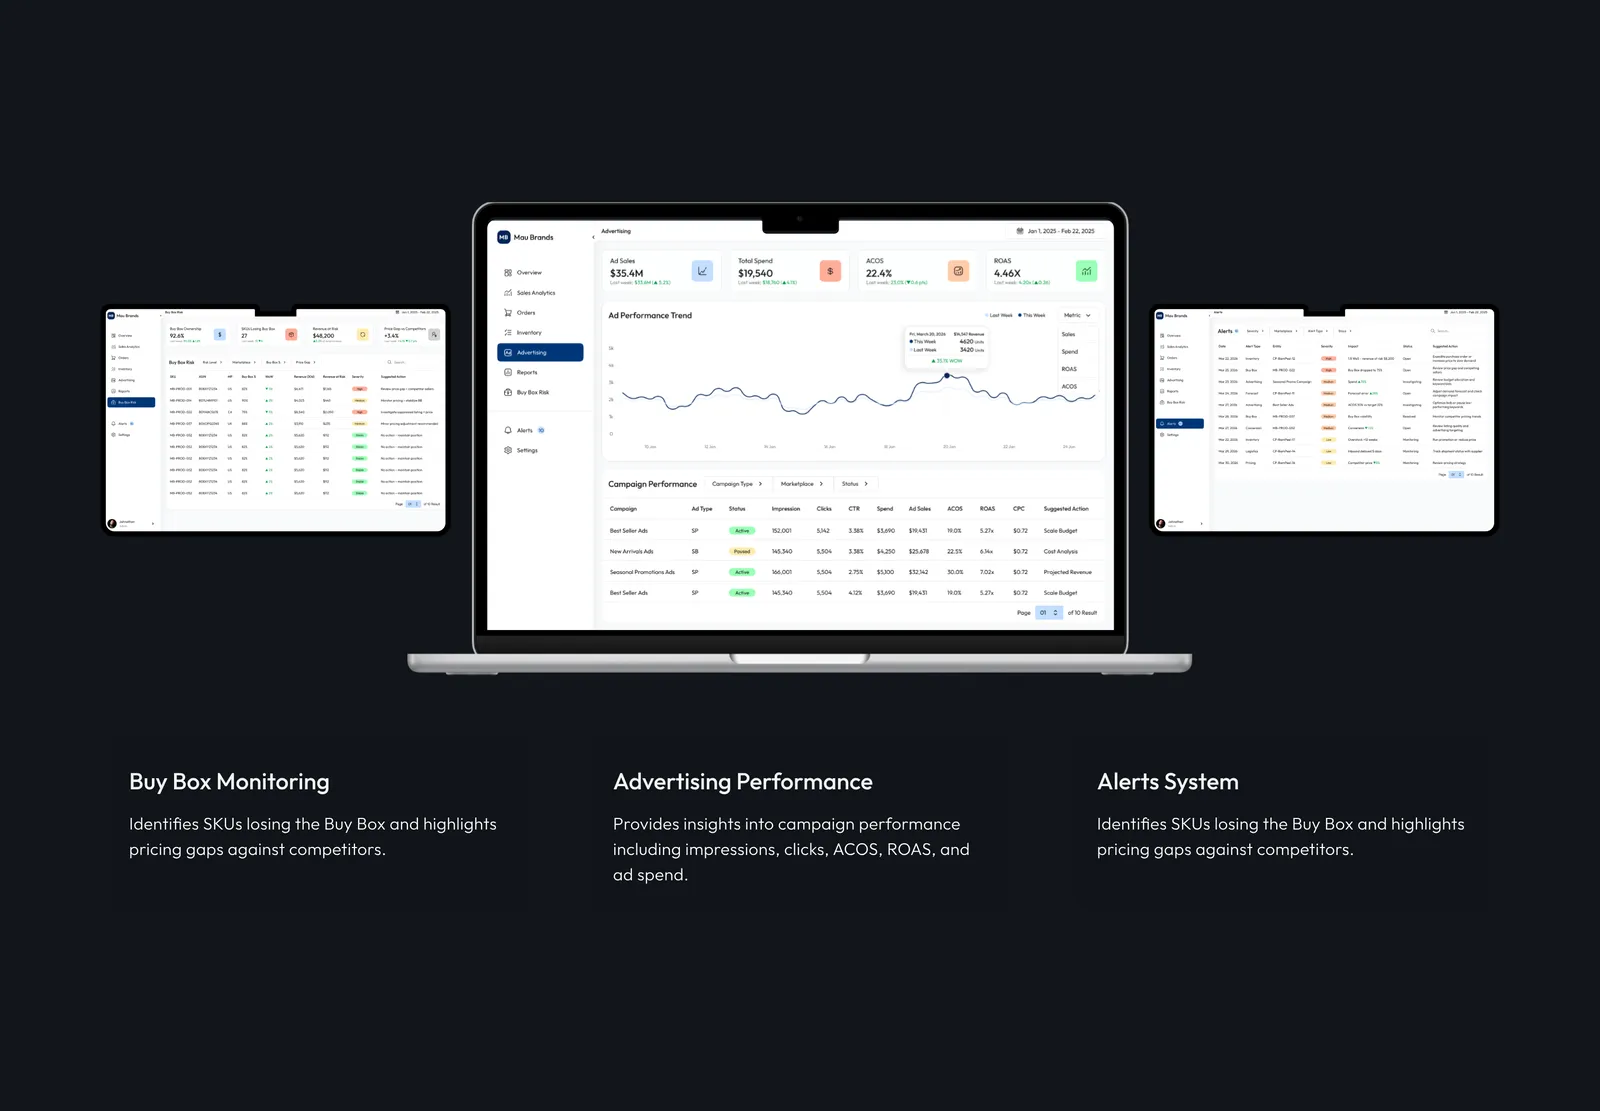
- Unified Dashboard: integrated sales, inventory, advertising, and pricing into a single view
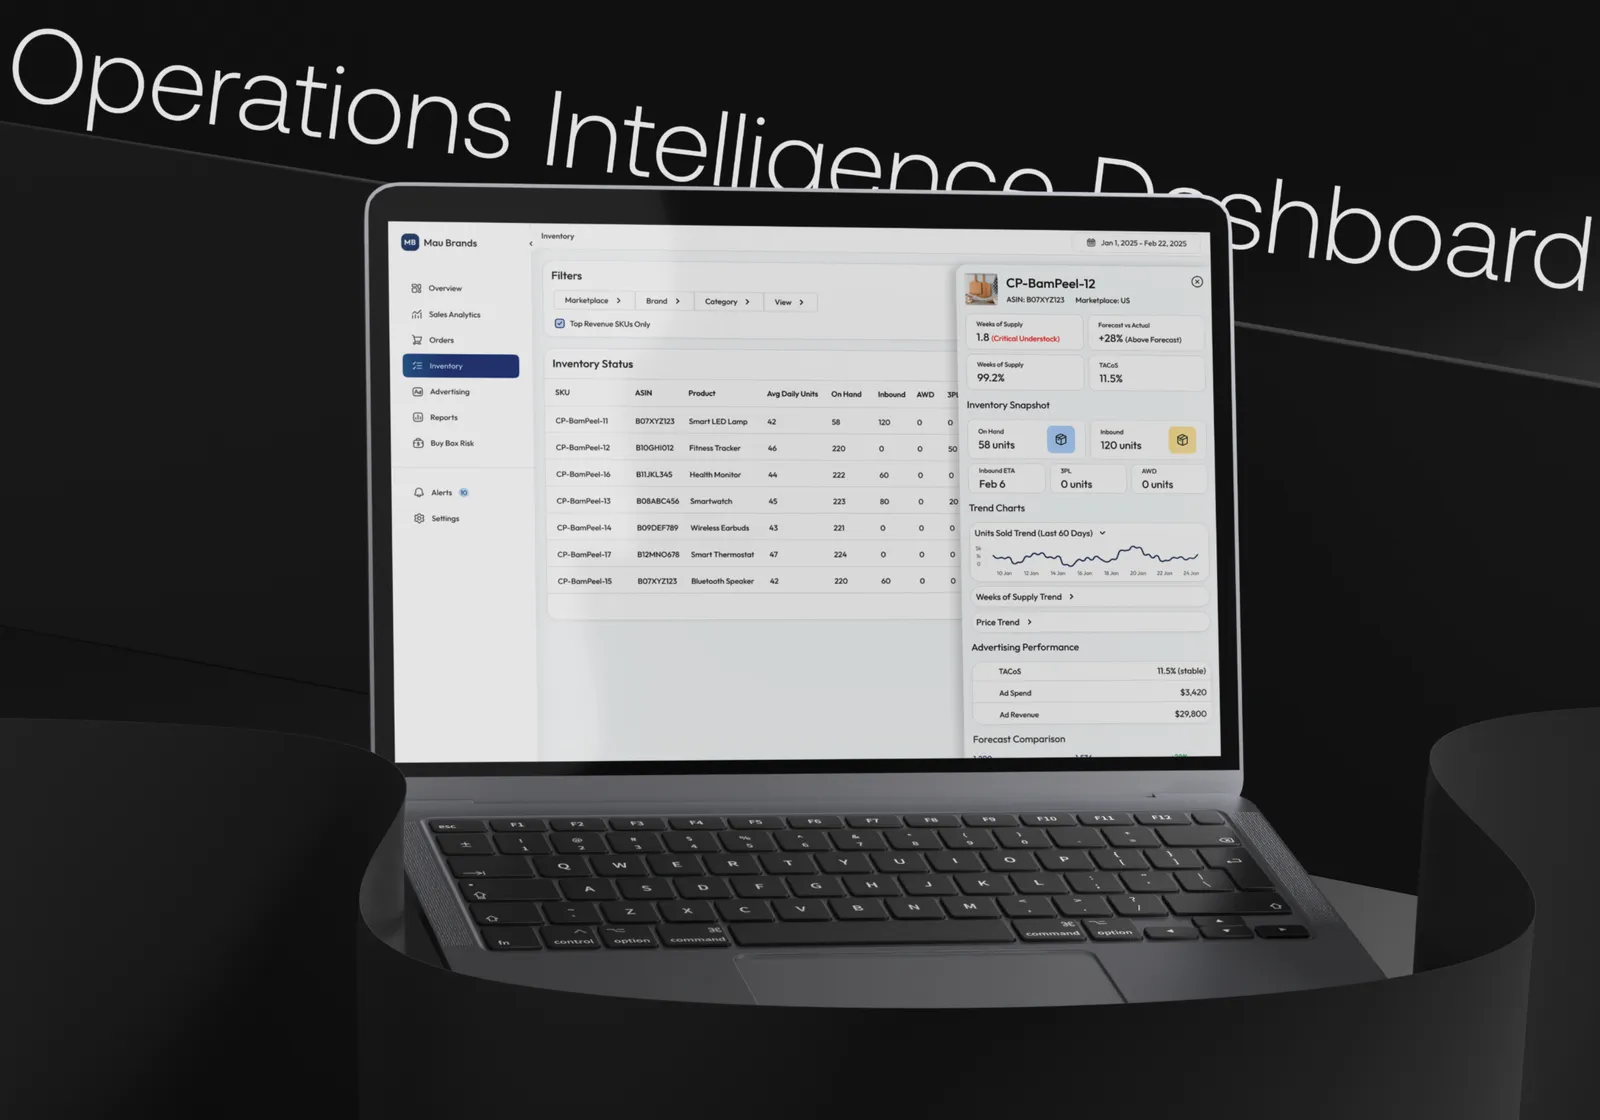
- Inventory Intelligence: built forecasting, Weeks of Supply tracking, and risk detection (understock / overstock)
- Advertising Insights: enabled performance tracking for ACOS, ROAS, spend, and campaign efficiency
- Buy Box Monitoring: introduced competitor pricing comparison and Buy Box risk analysis
The result
Improved decision-making speed with real-time dashboards, reduced dependency on spreadsheets, increased visibility into inventory and revenue risks, and provided scalable analytics infrastructure for growing brands.
Architecture
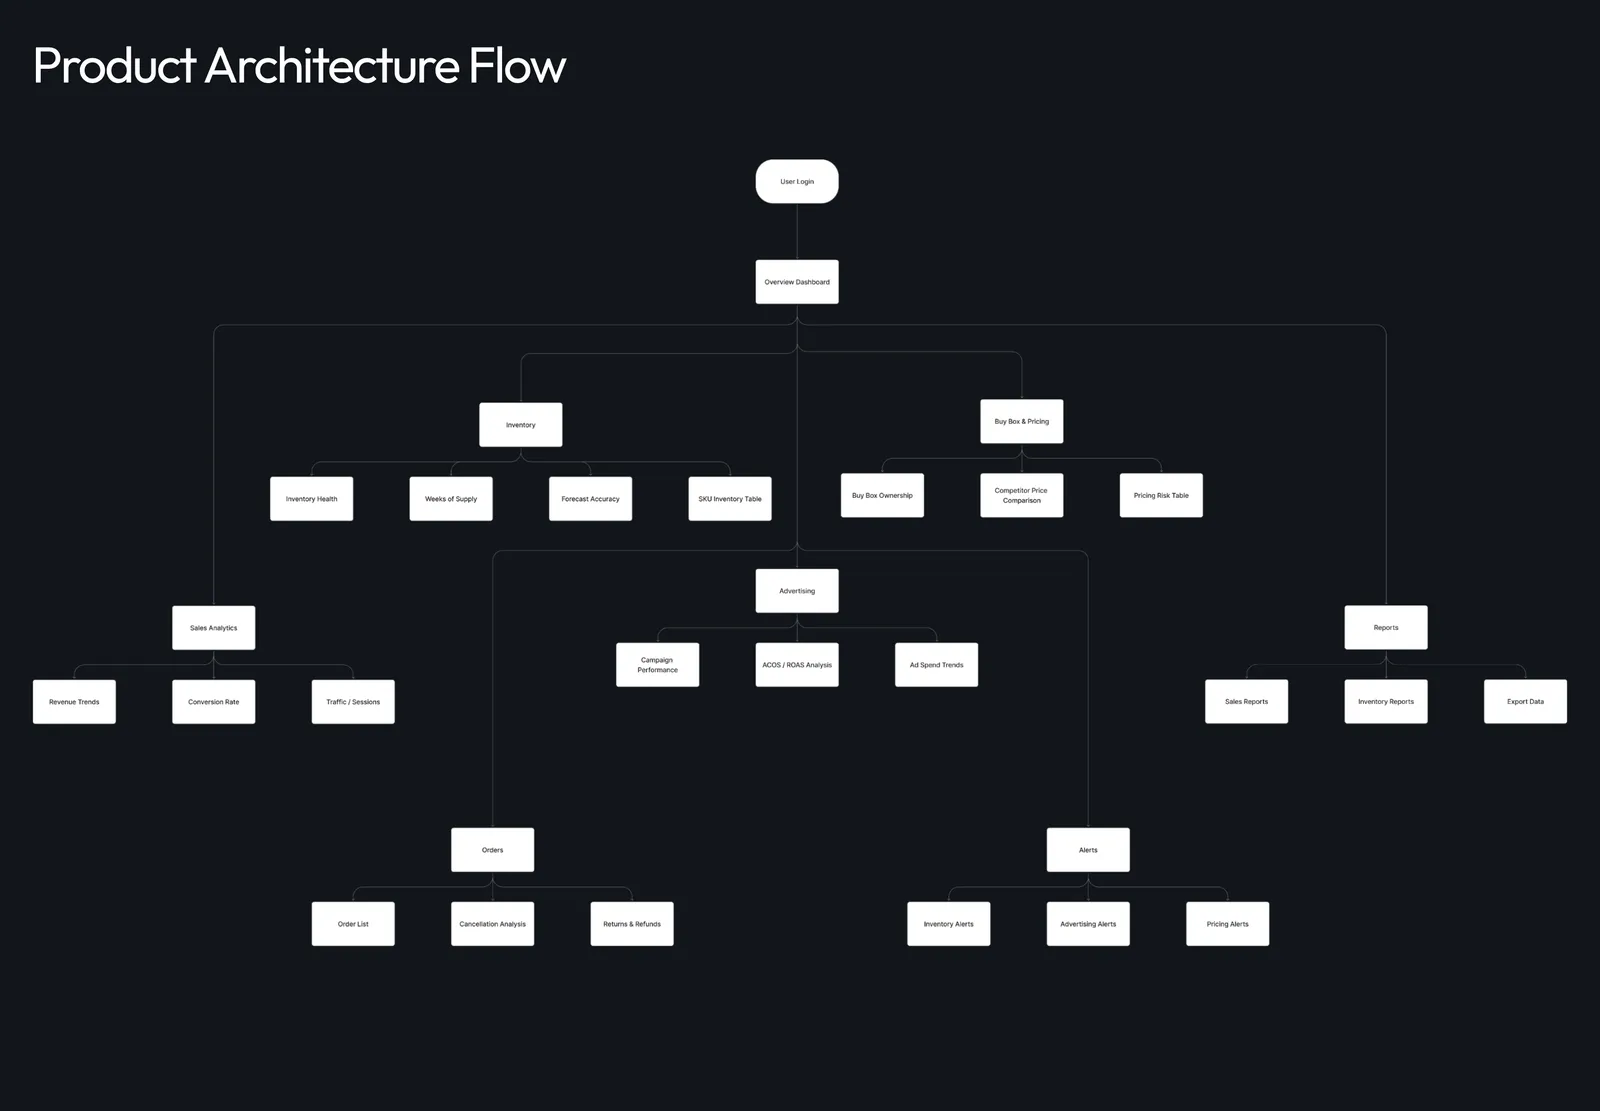
From the source data to the system on top.
Sources
 Amazon Seller Central
- Amazon SP-API
- Amazon Ads
- 01Amazon SP-API
- 02Amazon Ads API
- 03ETL pipelines
- 04Data warehouse
- 05BI dashboards
- 06Inventory forecasting
- 07Buy Box monitoring
The difference
Before and after.
Before
- Data scattered across Seller Central, Ads Manager and spreadsheets
- No real-time insights for decisions
- Inventory risks and demand hard to track
- Buy Box losses without a clear root cause
After
- Faster decisions with real-time dashboards
- Less dependency on spreadsheets
- Visibility into inventory and revenue risks
- Analytics infrastructure that scales with the brand
More case studies
More builds we’ve shipped.
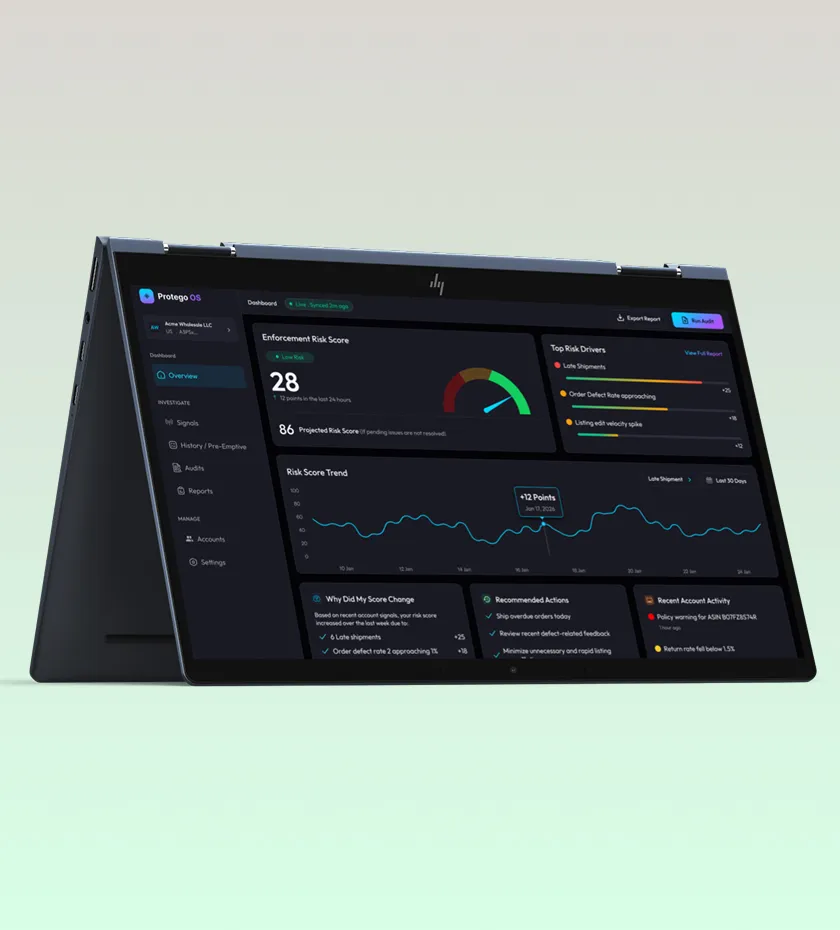
Risk scores in 5 min
Protego
We built Protego's SP-API backend: secure OAuth, ingestion pipelines and the Reports API workflow.
Read the case study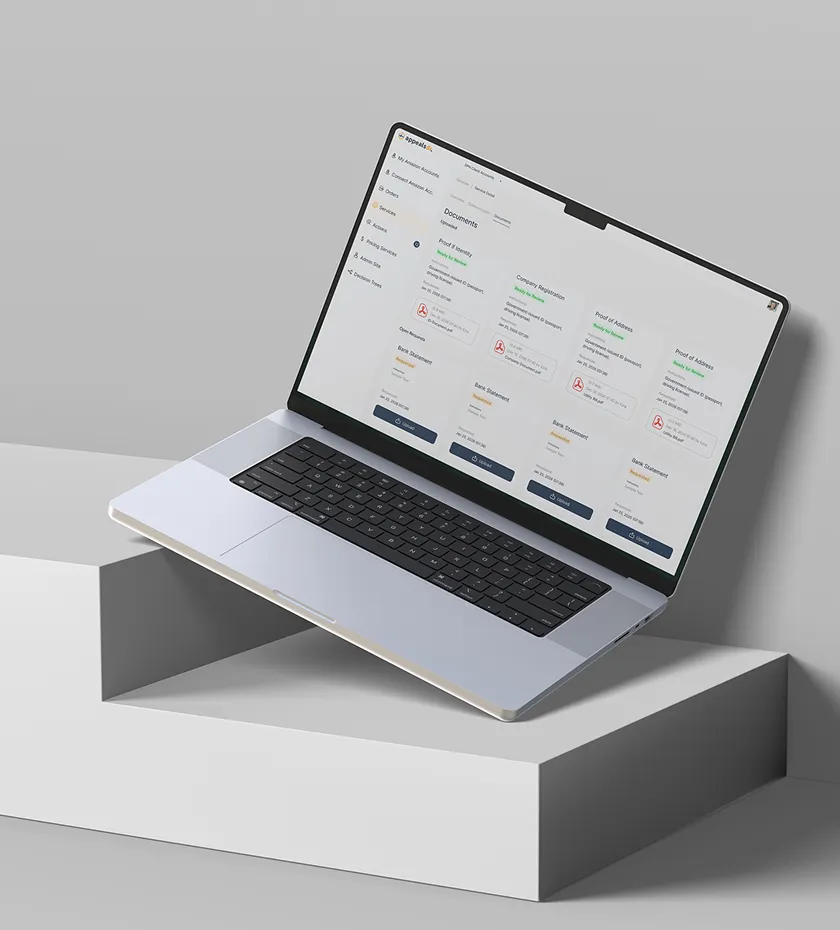
40+ cases in one system
Appeals Doctor
We built the case tracking, document handling and workflow system behind Appeals Doctor.
Read the case study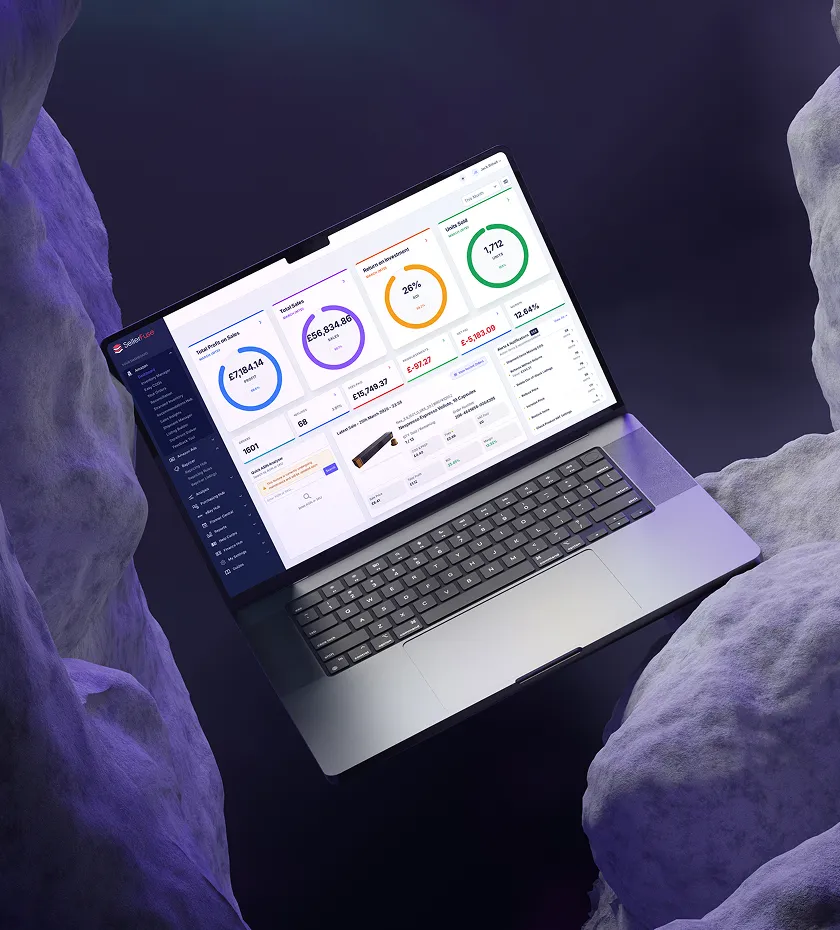
One pipeline, every client account
SellerFuse
We built the SP-API and Ads API pipelines, live dashboards and automation behind SellerFuse.
Read the case studyWant a build like this?
Tell us about your accounts and platforms. We'll tell you how we'd approach it, based on what we built for Mau Brands.