The month-end scramble ends
Account managers stop spending the first week of every month building reports.
Agency reporting automation
We pipe Amazon, Walmart, Google, Meta and TikTok data into one warehouse, define every metric once, and generate white-label dashboards and scheduled reports for each client.
What you get
Account managers stop spending the first week of every month building reports.
Every client report draws on the same tested definitions, so errors don't multiply with the client count.
Adding a client means adding configuration, not another afternoon of exports.
You own the raw data, so a custom metric is a dbt model away, not a feature request.
The problem
Every new client adds exports, VLOOKUPs, and a deck. At 20 clients it's annoying; at 100 it consumes whole roles, and the error rate climbs with the volume. A wrong number in a client report costs trust that took years to build. Reporting tools help until you need a metric they don't support; then you're back in spreadsheets.
Before and after
What we automate
How we work
Template the report your best account manager already sends; that becomes the spec
Pipe every platform into one warehouse instead of point-to-point dashboard connectors
Automate the top-N client reports first; long-tail clients inherit the same templates
Keep a human review step exactly where judgment is added, and nowhere else
Typical stack
Results
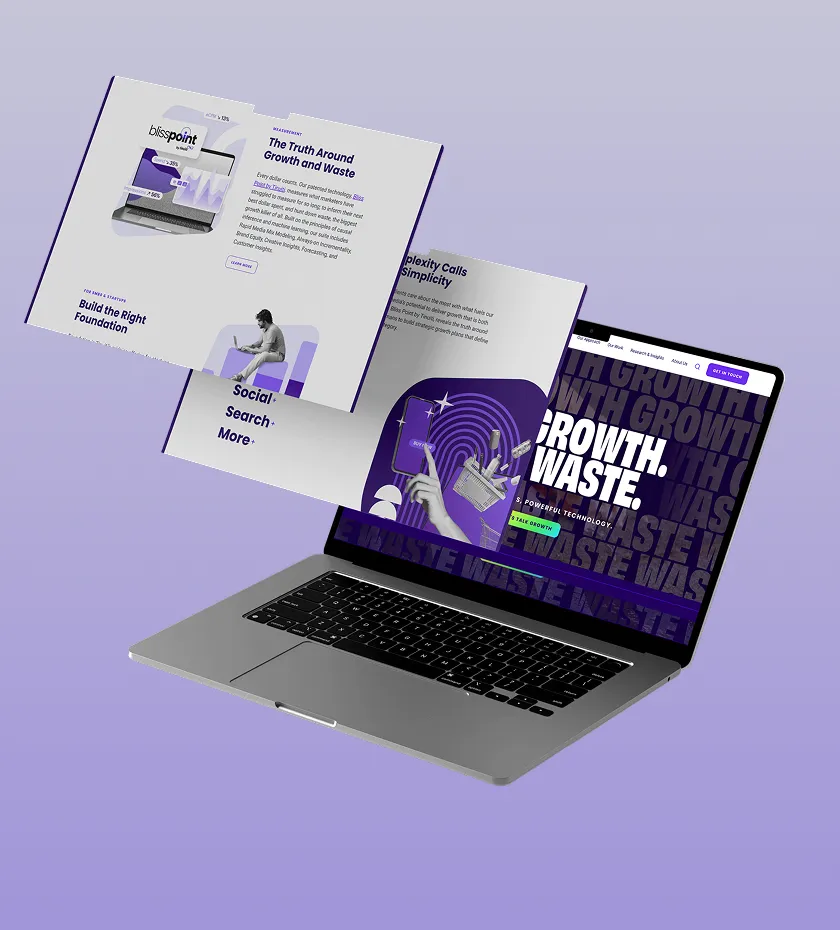
We rebuilt the ETL, warehouse and automation layer across Amazon, Walmart, TikTok, Instacart and Criteo.
Read the case study
We built ETL pipelines into one data model and one dashboard for Amazon, Walmart and Instacart campaigns.
Read the case study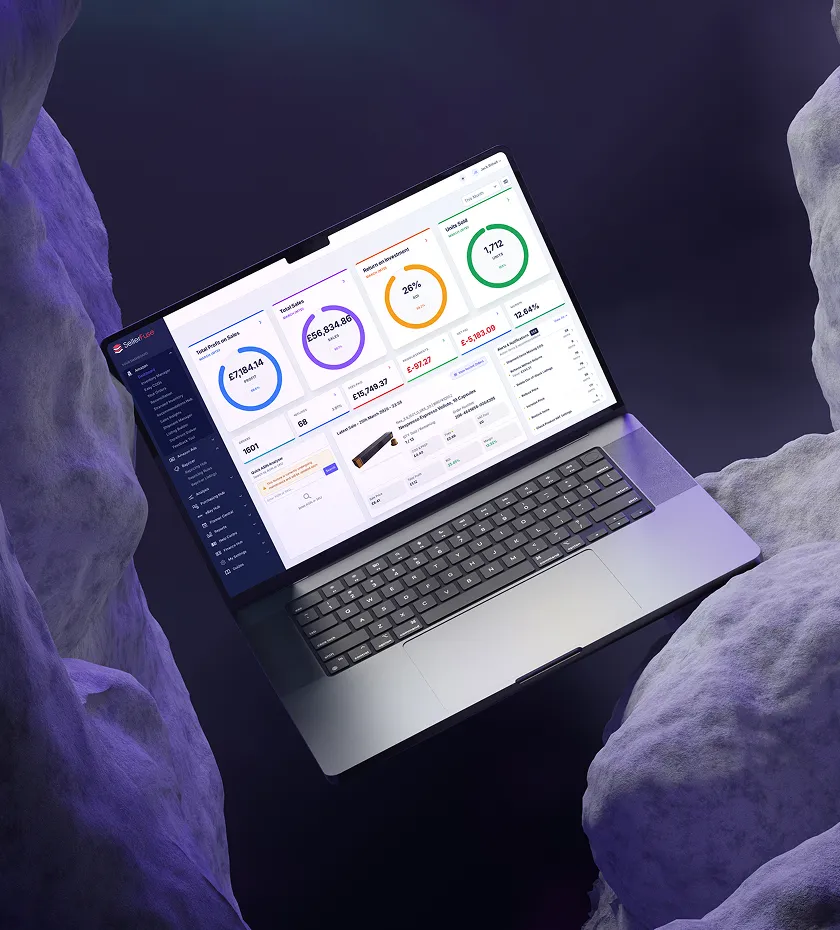
We built the SP-API and Ads API pipelines, live dashboards and automation behind SellerFuse.
Read the case study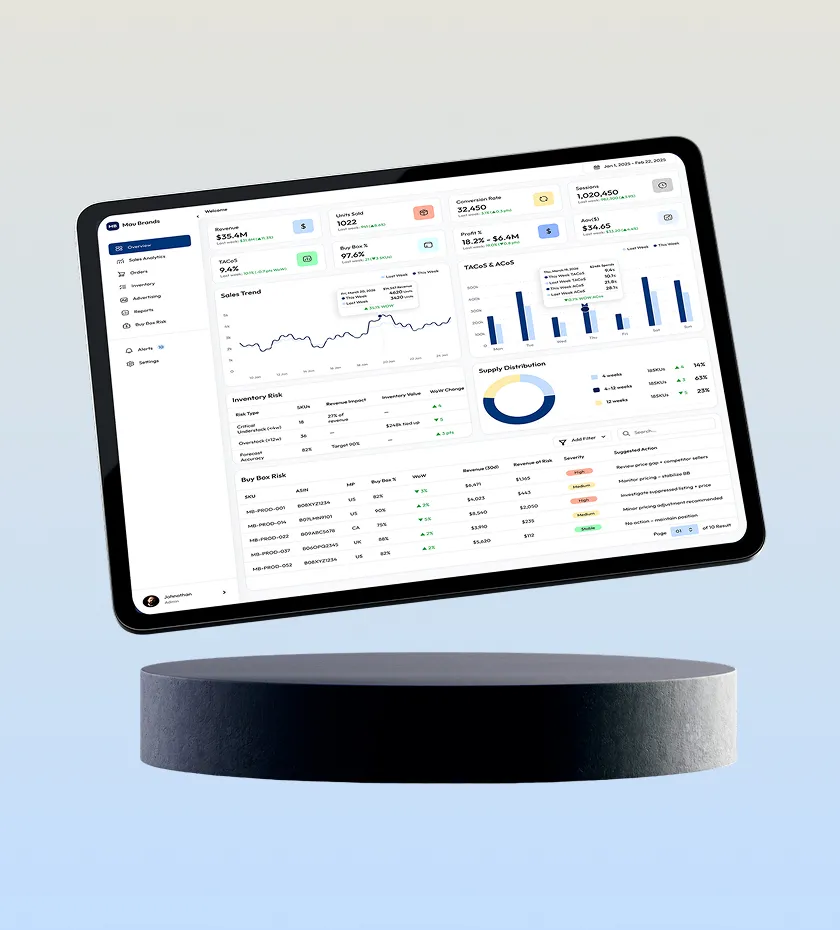
We built Mau Brands' Amazon analytics platform: sales, inventory, ads and pricing in one view.
Read the case studyFAQ
Agency reporting automation replaces manual client-report assembly with a data pipeline: ad-platform data flows automatically into a warehouse, metrics are computed once with consistent definitions, and client-facing dashboards and scheduled reports are generated from that single source, so reports are always current and never hand-built.
Off-the-shelf reporting tools are excellent until you need a metric, platform, or client-specific view they don't support. A warehouse-based pipeline owns the raw data, so custom metrics (margin-adjusted ROAS, inventory-aware pacing, cross-network dedup) are a dbt model away, and you're never locked into a vendor's connector list or per-client pricing.
Mau Brands cut manual reporting time by 25% after we automated it. How many hours come back depends on client count and report depth. The larger win is usually fewer errors and faster numbers: clients see yesterday's numbers today, instead of last month's numbers next week.
Yes. The right architecture is templates over a shared metric layer. Every client gets the same tested metric definitions, while layout, KPIs shown, branding, and commentary sections vary per client. Customization lives in configuration, not in a hand-edited spreadsheet.
Show us one client report you build by hand and we'll map the pipeline that builds it automatically for every client.